Dashboards
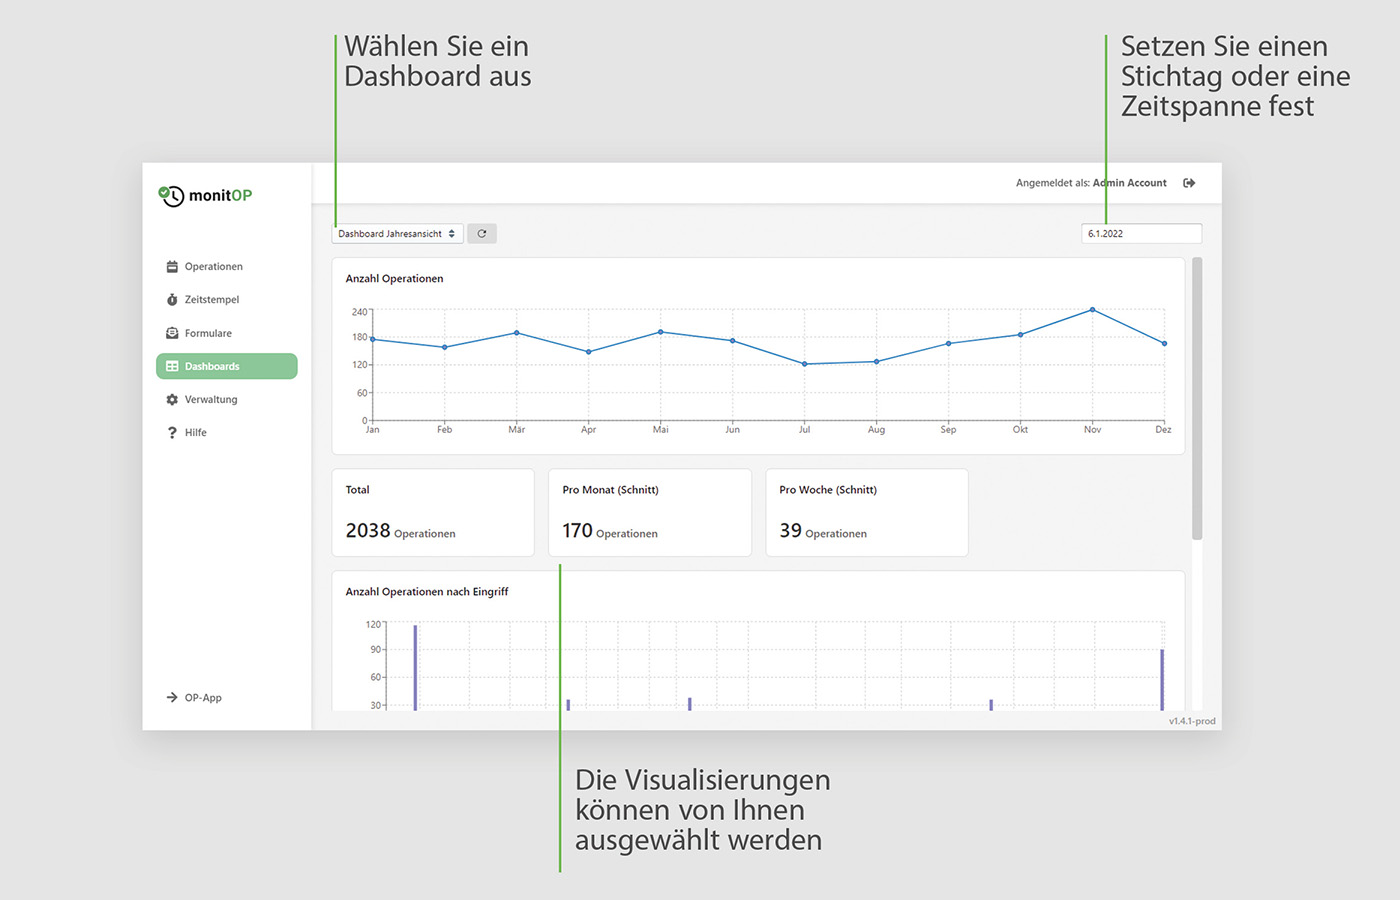
Visualize your data using individual dashboards
This module gives your staff and management direct insight into your institution. All data that is collected can be visualized in the form of dashboards. This allows you to see in real time which processes are experiencing difficulties and how efficiently your staff is working. But you can also retrospectively select a time period and compare, for example, the figures from different quarters or Geschäĸsjahren. You tell us which visualizations and data sets are important to you. We then create the right dashboards for you, individually tailored to your business.
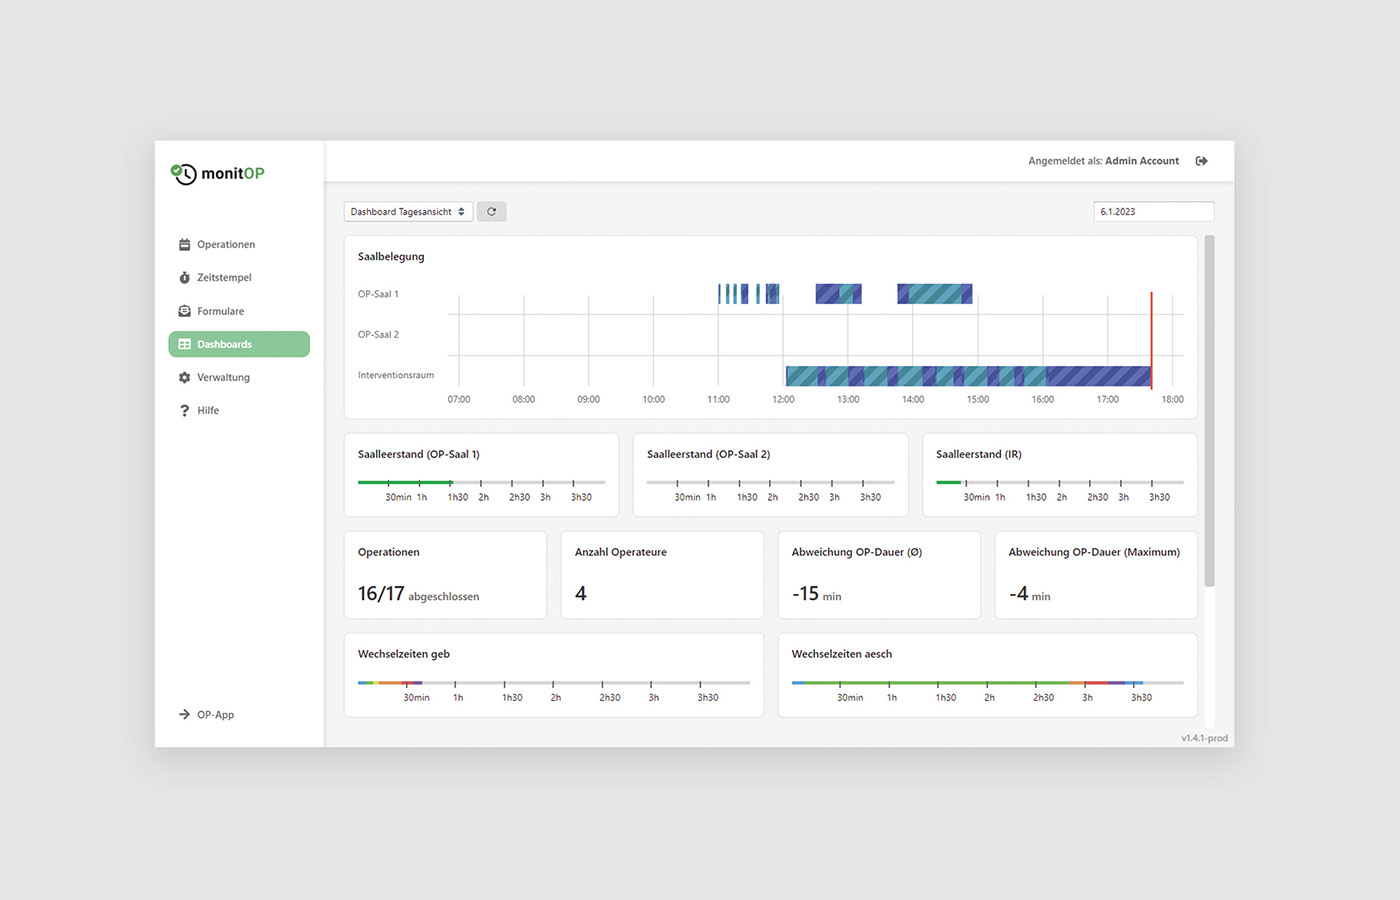
Combination with Timestamps
Combined with the Timestamps module, you can interactively explore, compare and evaluate processes such as OR duration or different waiting times. You can compare different operators, or investigate specifically to discover patterns.
Combination Forms
The Forms module provides you with additional data from your patients or other persons, which can also be statistically evaluated. For example, you can collect the net promoter score (NPS) or other important KPIs directly in real time. You can also see the response rate visualized for each form.